
Regional Economic Metrics & Market Velocity.
A rigorous examination of Bangalore's commercial landscape. We provide high-fidelity analytics focused on infrastructure scaling, tech sector density, and industrial land utilization across the 37th district and beyond.
Tech Absorption
12.2M
Square feet of Grade-A office space leased in Q1 2026.
Talent Inflow
+18%
Net migration of specialized STEM professionals to South Bangalore.
Energy Demand
4.1 GW
Peak industrial load capacity recorded across major tech hubs.
Venture Cap
$3.2B
Total equity funding secured by regional startups this quarter.
Thematic Market Breakdown
Our analytics engine synthesizes raw data from over 40 government and private sources to generate a clear picture of sectoral performance. We prioritize accuracy over optimism.

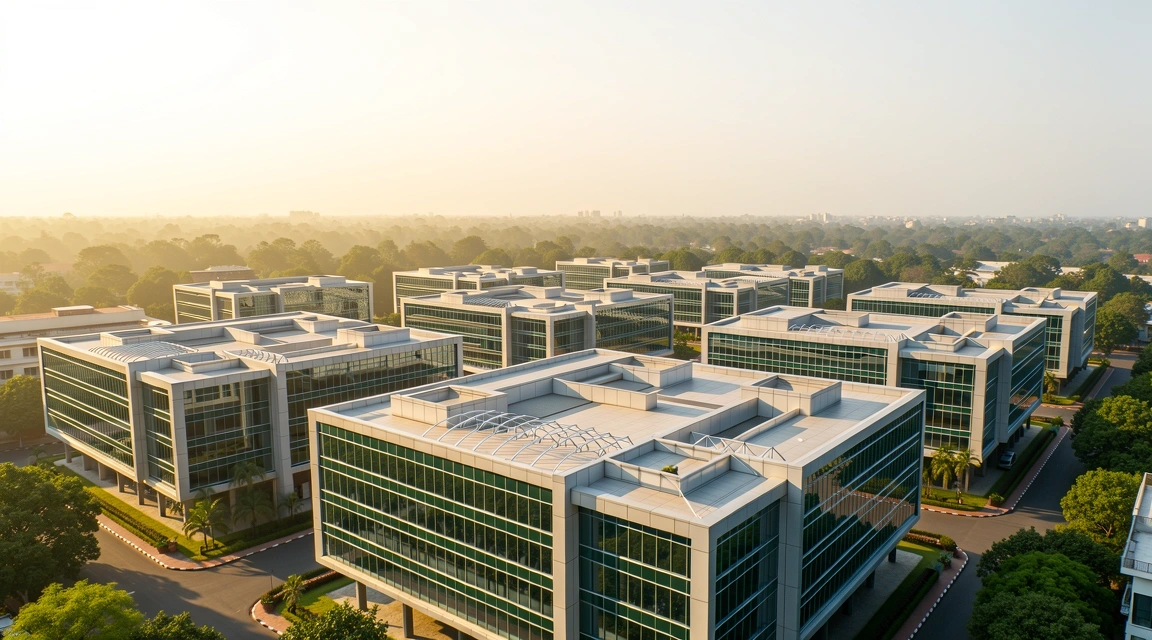
Infrastructure & Tech Hubs
As Whitefield and Electronic City reach capacity, the growth corridor is shifting toward North Bangalore near the international airport. Our metrics indicate a 22% increase in satellite office registrations in the Devanahalli suburbs. This shift is accompanied by a significant investment in multimodal transport links, reducing transit times between critical business districts.
- Connectivity Index: 8.9
- Power Stability: 99.4%
- Land Availability: High (North)
- Yield Projection: 7.2%
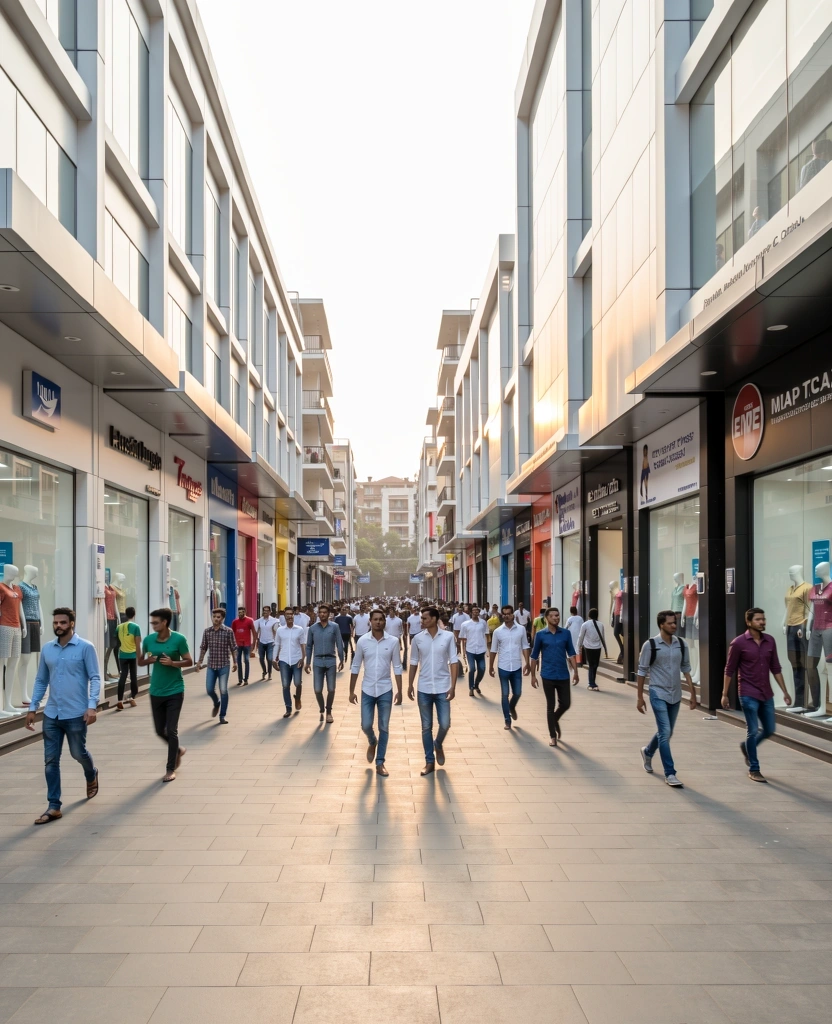
Retail & Consumer Consumption
Disposable income metrics across the 37th district show a resilient upward trend despite global headwinds. We are seeing a consolidation in the luxury retail space, with three new international plazas scheduled for completion by late 2026. Data suggests that the hybrid work model has redistributed retail demand, strengthening neighborhood-level commercial hubs over central business district plazas.
Our Analytical Standards
01. Primary Sourcing
We bypass third-party aggregators. Our team collects raw registration data, utility consumption logs, and corporate filings directly to ensure the highest integrity for every metric we publish.
02. Temporal Verification
All analytics are time-stamped with a 48-hour verification window. We do not recycle quarterly data into monthly reports without secondary field confirmation.
03. Localized Context
We account for micro-market nuances specific to Bangalore, such as ward-level regulatory changes and local infrastructure project timelines that generic national reports miss.
04. Peer Review
Before public release, every major data visualization undergoes validation by our senior economists to eliminate statistical outliers or collection errors.
Upcoming Releases
Scheduled updates to our market monitoring dashboards.
Hospitality Load Report
Analysis of luxury hotel occupancy rates vs. business travel volume indicators.
Industrial Corridor Q1
Manufacturing output metrics for the Nelamangala and Peenya industrial belts.
FinTech Concentration
Heatmap showing the density of digital payment firms in Central Bangalore.
Residential Spillover
Tracking the impact of commercial park growth on nearby housing prices.
Partner with Data Integrity
Our Bangalore-based team provides deep-tissue analytics that static global reports simply ignore. Secure access to our proprietary data portal or request a localized feasibility study today.